Sunday, September 21, 2014

A Statistical Look at Alexandre Burrows

The 2014-2015 season will mark Alexandre Burrows' 10th season in the league, all with the Vancouver Canucks. The left-handed forward was undrafted and fought his way through the QMJHL and the ECHL to crack the Canucks line-up. His highest scoring season was the 2009-2010 campaign where he scored 67 points (35G 32A) in all 82 games. In the next two season, Burrows would average 50 points a season (48 points, and 52 points, respectively) all while registering a shooting percent all around 15%. In the lockout-shortened 2012-2013 season, Burrows scored 24 points (13G 11A) in 47 games played, with a 9.3% shooting.

So I think the biggest question Canuck (and non-Canuck) fans are asking is, what the heck happened last season? We had seen 4 straight 20+ goal seasons, and a season, if fully played where Burrows might have hit 20 goals, and then the 2013-2014 season, where Burrows scored 15 points (5G 10A) in 49 games. So let's take a look into the numbers of what happened, because they are far more than what the conventional stats say.
 In the very first game of the season, the Canucks were playing the San Jose Sharks when Burrows dove to block a slapshot during a San Jose 5-on-3 advantage. While out for a couple weeks, Burrows was injured when a puck hit him in the face while on the penalty kill in a December game against the Carolina Hurricanes. So the answer is simple, right? We take Burrows off the penalty kill unit, and all will be dandy...Except it's not that simple. While he was on the ice last season, Burrows was a solid staple on the penalty kill. Of all the forwards who averaged over 1:00 of penalty kill (4-on-5) time per game (60 min), Burrows was 2nd on the team in blocked shots for, with 26.1/60, which averages to 0.87 blocks per 2 minutes of penalty kill ice time. To put into perspective, the leader on the team (who falls under the aforementioned parameters) was Christopher Higgins, who averaged 28.1 blocks/60. This averages to .94/2. And while it's important to note that Burrows' on-ice corsi during the penalty kill was worse than his off-ice corsi (-82.30% vs. -67.45%), keep in mind that of the forwards on the Canucks who averaged more than 1:00 of penalty kill ice time per game, Burrows had the second-highest QOC rating, which is a statistical look at the on-ice competition a player faces. I will saw though, that this stat alone is a bit flawed because taking out the average time requirement, Burrows' QOC rating was 5th on the team. I say this because the three players directly above Burrows, David Booth, Zac Dalpe, and Zack Kassian, all had average ice times of less than 0.10 minutes (less than 6 seconds of penalty kill ice time) per game. They averaged 0.05, 0.03, and 0.01 minutes, respectively. If you're curious for more stats, you can follow this link to BehindtheNet, where I got all the information.

Here is a table of some other stats from the site above:
PlayerTeam Sv %BF/60 OnG/60 OnGA/60 Off
Alex Burrows90126.14.686.05
Ryan Kesler81124.96.684.09
Christopher Higgins83028.15.615.07
Brad Richardson91817.53.335.25

Moving on!


This is a player usage chart I got fromSomeKindOfNinja. In case you haven't read any of my articles, I love player usage charts simply because of the visual aspect of a tremendous number of statistics they show. Let's break this one down! This is a chart depicting 5-on-5 (even strength) stats including offensive zone start%, QOC and Corsi R%. Each player is represented by a circle. Do you see Burrows' circle? It's all the way on the right, right near his line-mates for most of last season, Henrik and Daniel Sedin. The further right a player's circle is means the higher percentage of offensive zone starts. The higher up on the y-axis for a circle is indicative of higher Quality of Competition a player faced. If a circle is blue, then the player has a positive corsi rating, while a red circle means the player has a negative corsi rating. The smaller a circle is is indicative of a Corsi Relative% closer to 0. So it's better to have a large blue circle than a large red circle. There is a positive correlation between higher offensive zone start percentage and corsi percent, and I will elaborate on that a bit later. Burrows had the 6th highest Quality of Competition rating (0.48), while having the highest offensive zone start percentage (61.3%).
 Burrows' standard Corsi% average for his entire career (ignoring zone-start) is 54.6%. So this past season's number, 56%, while lower than the two previous seasons (58.4% and 58% respectively), was higher than his career average. Since a high number of offensive zone starts can inflate a player's overall Corsi, there is a way to compare all player corsis, despite the number of offensive zone starts. This is called Zone-start adjusted Corsi. Burrows' ZSACorsi from last season was 53.966%.
I am having trouble finding any seasonal summary of Burrows' zone exit/entry as well as passing distribution stats, which is too bad (If anybody has some, would you mind sharing?). While zone exit stats focus more on defensemen, zone entry stats are more indicative for forwards.
One more stat I'd like to look at is PDO, which is essentially a measurement of on-ice "luck". It combines on-ice save percentage and on-ice shooting percent. A score of 1000 is considered normal, while anything above 1000 is considered lucky, and anything below it, unlucky. Burrows' career PDO is roughly 1016, which is above-average in the quantified luck department. His PDO from the past season was 970, his career lowest, and 10th lowest in the league last season.
So the reason for Burrows' struggles last season was a combination of a series of injuries, strong defensive role and playing tough competition (Burrows was tied for 3rd on the team in QOC TOI% with 29.2%), and incredibly, almost comically, bad luck when shooting the puck towards the net (second lowest season shooting percentage in his career). Do I think Alex Burrows will bounce back? Of course, the numbers are all pointing to it! Now I don't think his offensive numbers will bounce back to right where they were, considering the fact that he might still be a bit rusty, and that he will most likely play on the second line of Vancouver, with Nick Bonino as center. Playing on the second line will help Burrows' bounce-back because his competition won't be as tough on the ice.

Pre-season is just about here, and every Canuck fan is looking forward to a bounce-back season from Alexandre Burrows.

Like what you read? Follow me on Twitter @DTJ_AHockeyBlog for more articles!

Wednesday, September 17, 2014

A World of Hockey: Perth Thunder, Australia

Today's edition of "A World of Hockey" finds us in the land down under, Australia...Western Australia to be precise. I find it an interesting time for Australian hockey considering at this most recent NHL Entry Draft, we saw the Washington Capitals select forward Nathan Walker 89th overall, becoming the first Australian-born player to be drafted into the NHL.

 The Perth Thunder are one of 8 total teams competing in Australia's top, semi-professional, league, the Australia Ice Hockey League (from now on referred to as the AIHL). The Thunder was founded in 2010, and later that year were able to gain a provisional license to begin play in the 2011 season, so it's a rather young team! They play their home games in Perth Ice Arena. Their General Manager, Stan Scott, also served as the team's head coach from 2012-2013, stepped down for a few months (April-May) in 2014, and is resuming his role as a head coach later that year (2014). 


Their colors are red, blue, and white, and feature red based home jerseys, and white based away jerseys.
   
                             (Home)                                                  (Away)
                                            (Jersey images found through Google)
The Perth Thunder are named after the city they play in, Perth...yup. But on a more serious note, it looks like the name, Thunder, is named after the 2010 Western Australian storms, which swept through cities in south-western Australia. The storms ended up causing over $1 Billion in repairs, the most expensive natural disaster in Western Australian history. I'm not sure how true this may be, but considering that the storms occurred in March of 2010 and the team was founded in later that same year, I'm pretty sure it's no coincidence.
Over the 3 year history of the franchise, they have only made the playoffs once, in 2013. (The AIHL season plays from mid-April through late August/early September of the same calendar year) Their record for last season, the 2014 campaign, was 9-15 with 2 SO wins and 2 SO losses. This was a bit of a drop-off from making it to the semi-finals of the playoffs the season before (their record then was 17-9 with 1 SO win and 1 SO loss).
The team's captain is Australian-born forward, Samuel Wilson. The alternate captains are Canadian-born forward, Daniel Ruck, and New Zealand-born forward, Andrew Cox. The Thunder's leading goal scorer from last season, Stuart Stefan, scored 44 points (14G 30A) in 28 games. The Thunder's second leading scorer was Justin Fox, who had 40 points (20G 20A) in just 21 games last season. You can find more information about the team stats over at the EliteProspects page, and at The AIHL player stats page. Looking at the roster, there looks to be 23 players. Of those 23, only 8 were born in Australia. In total there are 16 players on the team who are Australian citizens. The countries from where the other 7 players are from are New Zealand, USA, Canada, Finland, and UK.


While the team may not do live video streams of their games, they have very active social media accounts. The above video is from the Perth Thunder's Official Youtube Page, to which I will link later below.

Hockey is growing in Australia, and it's nice to take a look at one of the teams in the growing league! With the addition of the Perth Thunder, the AIHL split the teams into two conferences in order to "manage costs and length of the season". I mean, after all, it really can get lonely all the way over on the left:

(From EliteProspects)

While the population of Australia is very skewed towards the Eastern coast, is there a possibility of adding another team along the West coast, near Perth? Just some food for thought.

Important Links:
-AIHL Website
-Perth Thunder Web Site
-Perth Thunder Facebook Page
-Perth Thunder Twitter Account
-Perth Thunder Youtube Account
-More information from EuroHockey

Any comments or suggestions for what teams to write about next? Let me know! Don't forget to follow my Twitter account @DTJ_AHockeyBlog for more articles! Thanks for reading.

Tuesday, September 16, 2014

A Statistical Look at Eric Gelinas

Rookie defenseman, Eric Gelinas, really turned some heads in his first season with the New Jersey Devils. I feel this would be an appropriate time to look at his stats, considering that he just signed a 1 year extension with the team, worth $900,000...also known as a bridge contract, or a "prove-it" in my own view. As far as stats go, for defensemen it isn't as cut and dry to determine value, as there are so many different types of defensemen in the league. If we're going to use the terms EA uses for the NHL-franchise video games, there can be offensive defenseman (think Mike Greene from the Caps comes to mind), defensive defenseman (Kimmo Timonen), two-way (Ryan McDonagh), and enforcer (Zdeno Chara). Since there are so many possible uses of defensemen, there are a few overall ways to quantify performances of defensemen, such as basic and possession stats, zone start analyses, zone exit and entry stats, and player usage charts come to mind, immediately. In addition to the quantified evaluation, there is a certain qualitative analysis that goes into valuing a player (every player, not just defensemen). Do they fit into the team system? Are they able to hold their own? These are all important factors that must be taken into consideration when looking at a player.
So let's begin!

I think the first thing that really caught the attention of not only the coaching staff, but the fans, to Eric Gelinas happened a year ago today. In the beginning of the third period of a pre-season game against the Rangers, a powerplay was coming to a close when Gelinas got the puck along the blue line. With a quick movement of his hands, the puck was in the back of the net.


Gelinas played in 60 games in the NHL this past season and accumulated 29 points (7G 22A) in that time. His 6'4", 205 pound frame helped solidify his physical presence on the blue line. Gelinas became a real fan-favorite when his slapshot found the back of the net, once again against the Rangers. This time though, it was in overtime in MSG.


Okay, so a big, strong rookie defenseman emerges with a wicked slapshot. What happened? Well, there's a difference between using a young player to his advantages and helping him develop as an overall player. Gelinas found himself more and more limited to the powerplay, where he was on the point, rightfully so. But that was about it, really, for the NHL level. Eventually, Gelinas was sent down to Albany, the AHL affiliate of the Devils, to help further his development before stepping onto the "big ice" again. Personally, I think management sent him down after the disastrous outdoor game for the Devils, against the Rangers at Yankee Stadium, in January. Gelinas was caught a little flat-footed in his own end which resulted in lots of scoring chances and odd-man rushes for the Rangers. Justin Bourne, a writer for TheScore, does a fantastic breakdown of some of the things that went wrong in this article.
It's interesting to think about the difference between the progression of the NHL year between Eric Gelinas and fellow rookie defenseman, Jon Merrill. They both started on what seemed like opposite ends of the spectrum: Gelinas started out really hot and eventually cooled down, while Merrill was very quiet in his game, and eventually really began to step up as a defensive staple on the team. As for Gelinas's future role on the team? There's no doubt that slapshot is his key to the NHL, but I expect fellow offensive-defenseman, Marek Zidlicky, will mentor Gelinas on responsibility in pinching along the boards and providing offense without being a liability in one's own end. Unfortunately I don't see the possibility of the two being on the team for a very long time, since, right now, they are extremely similar in playing style.
But now that the qualitative look at Gelinas is over, let's look at some more numbers.
This picture above is called a player usage chart I copied from SomeKindOfNinja, a useful site for charts. Do you see Gelinas's circle? It's the small one on the very right. I have used player usage charts before in previous articles, so this is not something new, however this is a little different of a graph. Essentially the higher a circle is up on the y-axis, the tougher opponents they faced. The further right on the x-axis means the more times they are deployed for offensive zone face-offs. This is indicative of an offensive-defenseman, and can oftentimes boost one's corsi rating. Gelinas's circle is red because his Corsi relative% is negative, and if a circle is blue, like Adam Larsson's, it means that the Corsi relative% is positive. The size of the circle is indicative of the "size" in difference of Corsi relative%. What that means is that the smaller a circle is, the closer a Corsi relative% is to 0. Gelinas's Corsi relative% is -0.7, while Marek Zidlicky's is -1.6%, so Gelinas has a smaller circle because his Corsi relative% is closer to 0. Remember, this is 5-on-5 (even strength) ice time stats. 


The graph above is a look at how Gelinas compares to the other defencemen on the Devils in the categories of Corsi For% (blue), and Corsi Caused% (red). Gelinas flaunted the highest Corsi Caused% of any Devils defenseman last season, and but had the second-lowest Corsi For%.

 Gelinas logged 808:39 minutes of even-strength ice time last season. In that time, he registered 11 points (2G 9A) and had a 53.2% CorsiFor%. Taking into account his large amount of offensive zone starts, Gelinas's Zone-Start-Adjusted Corsi is 50.77%. His even strength stats included 0.148 goals/60min, 0.668 assists/60min, for a total 0.816 points/60min of ice time. While those numbers may not jump off the charts, remember that he is still a defenseman. How do these numbers compare to his powerplay stats. Gelinas played 141:02 minutes of ice time on the powerplay last season, registering 15 points (3G 12A) in that time. These numbers lead to a 1.276 goals/60 min, 5.105 assists/60min for a total 6.381 points/60min of powerplay time. How do these numbers compare to another offensively-focused defenseman? Below is a table differentiating Gelinas's numbers from Senators' defenseman, Erik Karlsson.

(Karlsson's numbers are just derived from this last season)

Gelinas Karlsson
ES G/60  0.148 0.518
ES A/60 0.668 0.852
ES P/60 0.816 1.37
PP G/60 1.276 0.75
PP A/60 5.105 4.126
PP P/60 6.381 4.877

This is not to say that Gelinas is a better or worse offensive-defenceman than Erik Karlsson. These numbers are just for reference. (All of these numbers were gathered from stats.hockeyanalysis.com.)

There is a statistic in hockey known as PDO, which is a measure of luckiness on the ice. It combines the shooting% of a player or a team as well as the team's save%. A PDO of 1000 is considered normal, and a PDO higher than 1000 is considered "lucky, and lower is considered "unlucky". Gelinas's PDO, according to ProgressiveHockey was 1008. This measurement is meant to show that Gelinas did not just get lucky on his goals and on the ice over the course of the season. Just for reference, the lower PDO last season was Alex Edler of the Vancouver Canucks, with a 954 PDO, and the highest PDO belonged to Dustin Penner and Gustav Nyquist, with scores of 1056. Interesting to note that Steve Bernier of the the Devils is second-lowest on that list, with a PDO of 959.

Two key stats for a defenseman, in my opinion, are passing % and zone exit numbers.


Player GP %DZ P %NZ P %OZ P O/DSt%
Marek Zidlicky 81 61.9 12.6 25.5 59
Adam Larsson 26 80.8 8.5 10.7 58
Andy Greene 82 68.9 13.4 17.7 47.2
Mark Fayne 72 70.8 13.5 15.8 47.2
Peter Harrold 33 68.2 11.3 20.5 50.8
Eric Gelinas 60 71.7 12.8 15.6 63.3
Bryce Salvador 40 77 8.7 14.4 51.3
Anton Volchenkov 56 73.4 12.1 14.5 49.7
Jon Merrill 52 69.2 13.7 17.1 55.5
Totals/Averages 502 69.4 12.4 18.2 53.6

Above are passing numbers for all Devils defensemen last season, taken from an article from In Lou We Trust. The measurements in the %DZP, %NZP, and %OZP are the percentage of passes made in each zone. For example, Eric Gelinas's %DZP was 71.7. That means that out of all the passes Gelinas made over the 60 games he played last season, 71.7% of them were in the defensive zone. 12.8% of his passes came in the neutral zone, and 15.6% of his passes came in the offensive zone. The very right column is a measurement of pass completion %. This means that of all the passes that Gelinas attempted last season, he completed 63.3% of them, which was the highest on the team.


Player GP Successes Attempts %Success Rate Poss. Exits %Poss. Exits Success/GP Attempts/GP D-Zone T/GP
Marek Zidlicky 81 599 733 81.7 335 45.7 7.4 9 1.51
Adam Larsson 26 187 231 81 104 45 7.2 8.9 1.35
Andy Greene 82 684 853 80.2 370 43.4 8.3 10.4 1.52
Mark Fayne 72 387 488 79.3 212 43.4 5.4 6.8 1.18
Peter Harrold 33 230 308 74.7 127 41.2 7 9.3 1.73
Eric Gelinas 60 321 432 74.3 187 43.3 5.4 7.2 1.55
Bryce Salvador 40 204 294 69.4 108 36.7 5.1 7.4 1.78
Anton Volchenkov 56 304 372 81.7 132 35.5 5.4 6.6 0.8
Jon Merrill 52 346 430 80.5 195 45.3 6.7 8.3 1.23
Totals/Average 502 3262 4141 78.8 1770 42.7 6.5 8.2 1.39

This chart is much wider, so mobile users aren't going to be too happy with it, but I really think it's just as important. This is a measurement of zone exit stats (from the same ILWT article). Like the passing table above, I included the entire defense for comparison. So let's break it down. Eric Gelinas had the puck in his own zone and attempted to exit the zone (get it?) into the neutral zone 432 times last season. Of those 432 times, he succeeded 321 times, meaning he had a success rate of 74.3%, which was actually below the team average of 78.8%. A defensive zone exit can either be done one of two ways: passing the puck or carrying it yourself. Carrying it yourself is referred to in the chart above as "Possession exits". Gelinas had 187 possession exits, meaning that 36.7% of his zone exits were possession. The next column is an average number of attempts and successes per game. Gelinas is averaging 5.4 successes of 7.2 attempts per game, which are both lower than the team average. This isn't necessarily a bad thing though.When a player is unable to exit the defensive zone, it is because of a turnover. The last column measures the average number of defensive turnovers per game. Gelinas 1.55 defensive turnovers per game. This isn't very good, but it's about the same as Andy Greene and Marek Zidlicky.
Gelinas is going to have to earn his spot on the team in the upcoming training camp, but that is a distinctive possibility. Devils fans know that they have a gem with this kid and that he is going to be a big player in a few years. He just needs to work more on his defensive game if he wants to thrive in the New Jersey system.

Like what you read? Follow me on Twitter @DTJ_AHockeyBlog for more articles!

Monday, September 15, 2014

A World of Hockey: Anyang Halla, South Korea


        The semester is proving to be much more writing-intensive than I had first imagined, but I want to write about something a little bit different. There’s an entire world of hockey out there. Did you know there are 4 ice hockey leagues in Mexico? There are 2 leagues in Thailand, 3 leagues in Turkey, 7 leagues in Poland, an international team in Kuwait, etc. The list goes on! In Canada, alone, there are over 200 registered ice hockey leagues, with almost 1300 teams! As important as the National Hockey League is to me, there is so much more hockey out in the world that I don’t think gets any attention. This could be because of a much lower skill level in the leagues, or because of the focus on another sport, mainly soccer/futbal. So I’m going to write a post, every once in a while, about a foreign league team, and title the section: A World of Hockey. So without further ado, here is Anyang Halla from South Korea.


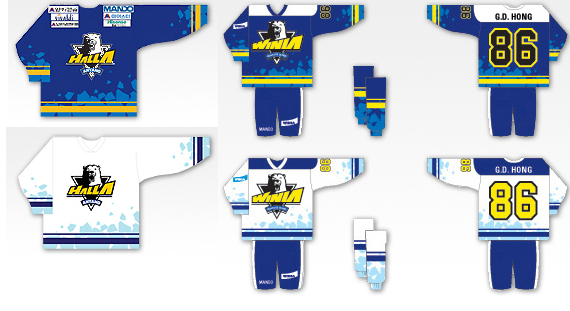
Anyang Halla was founded in December of 1994 in Anyang, South Korea. Their home arena is the Anyang Sports Complex in Anyang, and their colors are blue, gold, and white. Their home jerseys have a blue base color, while the away jerseys have a white base color. 


The team captain is 26-year-old, Korean-born defenceman, Kim Woo-young. The alternate captains are Korean-born defenceman, Kim Bum-jin and Canadian-born forward, Brock Radunske. As of now the head coaching position is vacant. This is due to the last head coach, Shim Eui-sik being fired in May of 2014 for “locker room related issues”. There are 23 players currently on the roster for Anyang Halla. Of those, 4 were born in another country, and 1 of those foreign-born players is now a naturalized Korean citizen. The ALIH is not well known for bringing in foreign talent, and I can understand why. If they are trying to improve the hockey programs in their own country, why would they want to bring in other people to take their jobs (as players on the ice)? That doesn’t mean they’re not interested, though, because bringing in good foreign talent will bring attention to the league, and, in turn, can help spread the game more around. While there have only been a handful of NHL players imported to play for Anyang Halla and the ALIH, the majority of imported players come from the Czech Republic and other lower-tier leagues in the world.

                 The leading scorer from last season was Brock Radunske, who scored 65 points (29G 36A) in 40 games last season. Mike Testwuide cam in second in scoring with 54 points (27G 27A) in 42 games. The entire stats list from last season can be seen here. From 2003 to present (under the name Anyang Halla), the team has amassed a total record of 209-115-20-9, with 13 OT wins, 20 OT losses, 9 ties, 12 SO wins, and 13 SO losses.

As the 2014-2015 season has started underway, Anyang Halla finds itself with a record of 2-3-1, good enough for 5th place in the league so far.

                The team gets its name from the owning body of it, the Halla Group, a South Korean business conglomerate. The company sponsors several hockey teams, including Anyang Halla and Kiekko-Vantaa, in a smaller Finnish league. Originally founded to help promote hockey in Korea, the team was originally named “Mando Winia”, named after a subsidiary company of the Halla Group, Mando. The team was known as “Mando Winia” from1994-1997. In 1998, the name was changed to “Halla Winia”, and stayed that way until 2004, where the name was changed to “Anyang Halla Winia”. Ultimately, in 2005, the name was changed to the present “Anyang Halla”.
                Before joining the Asia League Ice Hockey, from here on referred to as ALIH, Anyang Halla was a member of the Korea Ice Hockey League. In that league, Anyang Halla was one of 4 teams in the league, and were able to win the championship 5 times starting in 1998. In 2003, Anyang Halla was one of the founding member teams of the new league, the Asia League Ice Hockey. This new league arose because of the large amount of teams that folded in the Korea Ice Hockey League as well as the Japan Ice Hockey League. The leagues, essentially, decided to form together, along with a team from China in what they call “The Three Kingdoms on Ice”. As a member of the ALIH, Anyang Halla has won the championship twice, in 2010 and 2011. Anyang Halla is one of 3 total Korean teams in the ALIH. The other two are High1 and Daemyung Sangmu.
 Anyang Halla has one retired number, and that's #91 for Shim Eui-sik (the same head coach who was recently fired in May). In his entire playing career with Anyang Halla, Shim Eui-sik was the MVP of the Korean League 5 times, and held the record for most goals and points.


Interview from 2013 with Brock Radunske:


Anyang Halla's Official Team Song:


Highlights from a game last season:


More ALIH game highlights from last season can be found on this Youtube playlist.


And this one, specifically for Anyang Halla:


As of now, I'm having trouble finding ways to actively watch live streams of the games, so I can only go based off of highlight videos and standings updates.

Important Links:
-ALIH Web Site
-Anyang Halla team web site (if you have Google Chrome, it can automatically translate the page for you)
-Anyang Halla Facebook Page
-Anyang Halla Twitter Account
-More information from Eurohockey

Any comments or suggestions for what teams to write about next? Let me know! Don't forget to follow my Twitter account @DTJ_AHockeyBlog for more articles! Thanks for reading.

Saturday, August 30, 2014

What Can We Expect From Paul Stastny on the Blues?

Paul Stastny is a 28 year old Canadian center who’s played all 8 of his NHL seasons in Colorado. The 6’0, 205 pound Canadian-born, originally drafted 2nd round, 44th overall by Colorado in the 2005 NHL entry draft, signed a 4 year, $28 million contract with the St. Louis Blues on July 1st, the first day of free agency. This contract came with an Average Annual Value of $7 million.
                Last season, Stastny scored 25 goals and 35 assists, for a total 60 points, in 71 games played. This does not include the 5 goals and 5 assists, for a total 10 points in 7 games in the playoffs from last season. Stastny’s career highs for goals came in his rookie season, when he scored 28 in 2006-2007. Stastny’s career highs for assists and points came in the 2009-2010 season, when he had 59 assists and 79 points. Before I go further in his stats, I will just say that the “drop-off” in Stastny’s production is not a regression of talent, or a continuation of a “sophomore slump”, it is simply because of Stastny’s game at this point included a more defensive aspect to it.
                I compiled a “goal map” from all the spots on the ice where Stastny scored from last season. Based off feedback from a similar post to this, I am posting this before I break down the rest of the stats. So let’s take a look:


Just a quick key:
W - Wrist Shot
S - Slap Shot
O - One-timer
D - Deflection
R - Rebound
B - BackhandT - Tip
E - Empty Net

                Rebounds, rebounds everywhere. Stastny’s goals from last season pan out to show a center that stays around the goal crease to either screen the goalie, tip-in a shot from the point, or the mash in a rebound at the side or front of the net. This shows that Stastny is able to fight for that position and will fit in with a team with a more physical style of play, like the Blues. One thing that this map is unable to show is just how fast Stastny’s hands are. The ability he has to get the puck off his stick almost as soon as it’s on it is extremely impressive.
                Now let’s get into more of Stastny’s statistics. To look at possession stats, we look at Behindthenet.ca. Last season, Stastny had a +8.4 Corsi Relative%, which is quite impressive considering that Colorado was 25th in the league in Corsi for%, with a 47%. This would make Stastny’s Corsi For% for last season to be a 55.4%. Compared to the Avalanche, the Blues were 5th in the league in Corsi For% last year, with a 53.1%. To see if Stastny’s possession stats were inflated, or to see how his possession affected other teammates, we look to what’s called WOWY stats (with or without you) on stats.hockeyanalysis.com. Last season, we can look at how Stastny’s linemate, Gabriel Landeskog, performed while Stastny was on and off the ice. When the two were on the ice together, Stastny had a Corsi For% of 50.5%, and Landeskog had a 50.8%. When apart, Stastny had a Corsi For% of 49.3% and Landeskog had a Corsi For% of 45%. There was a mutual inflation of possession stats between the two, as Stastny’s percentage was raised by 1.2% and Landeskog’s raised by 5.8%. I made a table to better show their relationship:


Player
CF% when together
CF% when apart
Paul Stastny
50.5
49.3
Gabriel Landeskog
50.8
45

                Let’s take a look at the WOWY for Stastny and his other linemate from the past season, Nathan MacKinnon.  When they were on the ice together, Stastny had a Corsi For% of 50.5% and MacKinnon had a Corsi For% of 46.5%. When they were apart, Stastny had a Corsi For% of 52.3% and MacKinnon had a Corsi For% of 47%. There was a mutual deflation of possession stats when both were on the ice. MacKinnon had an overall Corsi For% of 47.9% last season, so it’s going to be interesting to see how MacKinnon’s possession stats pan out next season. Below is a table of the possession stats for the two while on an off the ice last season.
Player
CF % when together
CF% when apart
Paul Stastny
50.5
52.3
Nathan MacKinnon
46.5
47

                So how do these possession stats compare to Stastny’s future linemates? Before I continue, I will just say that while I will address Stastny’s placement in the lineup later on in the write-up, I’m going to assume that his future linemates will be Jaden Schwartz and Vladimir Tarasenko. Last season, Tarasenko played 431:19 minutes on the ice with Patrik Berglund. When they were on the ice together, Tarasenko had a Corsi For% of 58.1% and Berglund had a 57.9% Corsi For%. When apart, Tarasenko had a Corsi For% of 58.2% and Berglund had a Corsi For% of 51.8%. This means that Tarasenko had a 6.1% inflation on Berglund’s possession stats. According to Behindthenet.ca, Tarasenko had a Corsi Relative% of +17.7% last season, which is unbelievably good. This possession inflation by Tarasenko on Berglund is seen again in a larger sample size. In the possession stats from 2012-2014, Tarasenko inflated Berglund’s possession stats by 8.2% (from 49.6% without to 57.8% with). A rough equivalence of Stastny’s adjusted Corsi For% of 55.4% would bring him above the Blues’ team average (53.1%).
                 So Stastny will bring with him a positive effect on the Blues’ possession stats, but what about offensive production? What does Stastny bring to the Blues? Last season saw a good jump in offensive production from Stastny, jumping to 0.998 goals/60min, 1.174 assists/60min, and 2.171points/60 min of even strength ice time in the 2013-2014 season from 0.550 goals/60min, 0.550 assists/60min, and 1.100 points/60min of even strength ice time in the lockout-shortened 2012-2013 season. To make sure this is not a statistical anomaly, I will use statistics from the past 4 seasons, which is 2010-2014. In that time, Stastny had an average of 0.770 goals/60min, 0.943 assists/60min, and 1.713 points/60min of even strength ice time. How does this compare to potential linemates, Jaden Schwartz and Vladimir Tarasenko? In his first 2 NHL seasons, Tarasenko averaged 0.883 goals/60min, 1.324 assists/60min, and 2.207 points/60min of even strength ice time. In his first 3 NHL seasons (yes I am including the 73:54 minutes played from 7 games in 2011-2012 season), Schwartz averaged 0.828 goals/60min, 1.115 assists/60min, and 1.943 points/60min of even strength ice time.
I’ve made a table below to help visualize (to help differ any confusion, I added the seasons involved in the table):

Player
Seasons
Goals/60
Assists/60
Points/60
Paul Stastny
2010-2014 (4 yr)
0.770
0.943
1.713
Vladimir Tarasenko
2012-2014 (2 yr)
0.883
1.324
2.207
Jaden Schwartz
2011-2014 (3 yr)
0.828
1.115
1.943


                What this means is that with the offensive injection from Stastny, and the fact that all 3 are all under 30, and still improving leads me to believe that all 3, if they play on the same line together, will have an increase in offensive production for the next season. As for specific numbers expectations, to determine a baseline number of what can be expected of Stastny for next season, I took the average number of shots taken from the last 5 full NHL seasons (so excluding the lockout-shortened 2012-2013 season), adjusted the number according to age and/or potential linemates, and multiplied the result by his career average shooting percentage (he had a 16.7 shooting percent last year…incredible). The average number of shots taken is 167.6 shots. Without adjustment, multiplying that shot average by his career shooting percent (12.8%) brings an expected result of 21 goals for next season. Seeing as his shot number dropped from 190, in 2011-2012, to 150, from last season, and that Stastny played 8 more games in 2011, I adjusted Stastny’s shot count by adding 8 shots because of the games missed by injury. Why did I adjust it to that? Because over the course of his career, Stastny has averaged about 2 shots / game, and that number would bring his estimated “game count” to 75. This adjusted shot count brings the expected goal count for the upcoming season to 23 goals (originally 22.5, so I rounded up).
                So where does Stastny fit in on the line projection of the Blues? The statistics I listed above are all assuming he plays on the second with the projected linemates of Tarasenko and Schwartz, but St. Louis’s General Manager, Doug Armstrong, has said "We're not your normally defined first, second, third line. We're more of a group of nine forwards…” and has not ruled out the possibility of Stastny playing on the top line with David Backes on the wing. If the two were to play on the same line, I would assume Stastny would be center because of his face-off percentage from last year, where he was 29th in the league with a 54.1% victory margin vs. Backes’s 51.7%, good enough for 32nd in the league. It may not be a huge advantage, but any step-up that can help the team get a leg-up should certainly be considered. The advantage of having Stastny as 2nd line center will be relieving a good amount of defensive pressure off of top-line center, David Backes. Stastny will add a big amount of defensive forward depth to the team as well. Last season, Stastny came in 16th in the league in Selke voting (the Selke award is given to the best defensive-minded forward), and Backes came in 4th in the voting, so that provides a great 1-2 punch of potential shut-down forwards. I think a big factor in where Stastny finds himself in the line-up will be whether 26-year old prospect, Jori Lehtera, and 30-year old free agent signing, Joakim Lindstrom, find themselves in the line-up. I believe Lehtera will be in the opening night line-up, but Lindstrom will be the major wildcard in the upcoming weeks.
                St. Louis landed themselves the top free agent of the offseason, and while $7 million a year (roughly) is quite steep, Stastny is still in his prime and is looking to bring a key piece for the Blues as they search for the everlasting immortality that is the Stanley Cup.

Thanks for reading!

Like what you read? Follow me on Twitter 
@DTJ_AHockeyBlog or leave a comment! Thanks for reading.

Tuesday, August 26, 2014

A Look at Which NHL Prospects Playing in the Champions Hockey League Tournament

A new era of European hockey is upon us. The European Champions League Hockey Tournament is up and rolling. This tournament takes the best teams of the many European leagues and pits them against each other to see who is the best team in Europe. It is very similar to, if not exactly the same as, the Champions League soccer (or futbal). There was an attempt in 2008 to establish a Champions Hockey League, and the first season was somewhat of a success. However, the IIHF (the governing body of international hockey) was forced to shut down the tournament due to financial concerns. But it is 2014, and two days of tournament play has already happened, featuring 11 "divisional" groups with 4 teams in each. So there are 44 teams from leagues all around Europe: Switzerland, Germany, Sweden, Finland, Norway, England, France, Italy, Denmark, Czech Republic, Slovakia, and Austria. This international tournament gives a great spotlight on up-and-coming talent as well as a window to view NHL prospect development through. I have compiled a list of NHL prospects playing in the tournament. There are 28 draft picks from the 2014 draft, 10 picks from the 2013 draft, 8 picks from the 2012 draft, 2 picks from the 2010 draft, and a free agent signing that are the NHL prospects playing in the tournament. I've compiled a list of all the prospects I researched were playing (yes, through HTML) into the table below.

Year Player Position Round Overall NHL Team CHL Team Country Nationality
2014 Kevin Fiala L 1 11 Nashville HV71 Jönköping Sweden Switzerland
2014 Jakub Vrána L/R 1 13 Washington Linköping HC Sweden Sweden
2014 Kasperi Kapanen R 1 22 Pittsburgh KalPa Kuopio Finland Finland
2014 Marcus Pettersson R 2 38 Anaheim Skellefteå AIK Sweden Sweden
2014 Vítek Vaněček G 2 39 Washington Bílí Tygři Liberec Czech Republic Czech Republic
2014 Andreas Englund D 2 40 Ottawa Djurgården Stockholm Sweden Sweden
2014 Julius Bergman D 2 46 San Jose Frölunda Gothenburg Sweden sweden
2014 Noah Rod R 2 53 San Jose Genève-Servette Switzerland Switzerland
2014 Anton Karlsson R 3 87 Arizona Frölunda Gothenburg Sweden Sweden
2014 William Lagesson D 4 91 Edmonton Frölunda Gothenburg Sweden Sweden
2014 Ville Husso G 4 94 St. Louis IFK Helsinki Finland Finland
2014 Linus Söderström G 4 95 New York Islanders Djurgården Stockholm Sweden Sweden
2014 Lucas Wallmark C 4 97 Carolina Luleå Hockey Sweden Sweden
2014 Christoffer Ehn C 4 106 Detroit Frölunda Gothenburg Sweden Sweden
2014 Viktor Arvidsson L 4 112 Nashville Skellefteå AIK Sweden Sweden
2014 Gustav Forsling D 5 126 Vancouver Linköping HC Sweden Sweden
2014 Joonas Lyytinen D 5 132 Nashville KalPa Kuopio Finland Finland
2014 Anton Lindholm D 5 144 Colorado Skellefteå AIK Sweden Sweden
2014 Andreas Söderberg D 5 148 Chicago Skellefteå AIK Sweden Sweden
2014 John Nyberg L 6 165 Dallas Frölunda Gothenburg Sweden Sweden
2014 Julius Vahatalo L 6 166 Detroit TPS Turku Finland Finland
2014 Adam Ollas Mattsson D 6 175 Calgary Djurgården Stockholm Sweden Sweden
2014 Hugo Fagerblom G 7 182 Florida Frölunda Gothenburg Sweden Sweden
2014 Pierre Engvall L 7 188 Toronto Frölunda Gothenburg Sweden Sweden
2014 Kevin Elgestal R 7 194 Washington Frölunda Gothenburg Sweden Sweden
2014 Axel Holmström C 7 196 Detroit Skellefteå AIK Sweden Sweden
2014 Jesper Pettersson D 7 198 Philadelphia Linköping HC Sweden Sweden
2014 Emil Johansson D 7 206 Boston HV71 Jönköping Sweden Sweden
2013> Carl Dahlstrom D 2 51 Chicago Linköping HC Sweden Sweden
2013 Artturi Lehkonen L 2 55 Montreal Frölunda Gothenburg Sweden Finland
2013 Linus Arnesson D 2 60 Boston Djurgården Stockholm Sweden Sweden
2013 Marcus Hogberg G 3 78 Ottawa Linköping HC Sweden Sweden
2013 Peter Cehlarik L 3 90 Boston Luleå Hockey Sweden Slovakia
2013 Felix Girard C 4 95 Nashville Genève-Servette Switzerland Canada
2013 Robin Norell D 4 111 Chicago Linköping HC Sweden Sweden
2013 Saku Maenalanen R 5 125 Nashville Karpat Oulu Finland Finland
2013 Anton Blidh L 6 180 Boston Frölunda Gothenburg Sweden Sweden
2013 Andreas Johnson R 7 202 Toronto Frölunda Gothenburg Sweden Sweden
2012 Oskar Sundqvist C 3 81 Pittsburgh Skellefteå AIK Sweden Sweden
2012 Erik Gustafsson D 4 93 Edmonton Skellefteå AIK Sweden Sweden
2012 Erik Karlsson C 4 99 Carolina Frölunda Gothenburg Sweden Sweden
2012 Calle Andersson D 4 119 New York Rangers EV Zug Switzerland Sweden
2012 Daniel Zaar R 6 152 Columbus Luleå Hockey Sweden Sweden
2012 Christoph Bertschy C 6 158 Minnesota SC Bern Switzerland Switzerland
2012 Max Gortz R 6 172 Nashville Frölunda Gothenburg Sweden Sweden
2012 Mikael Wikstrand D 7 196 Ottawa Frölunda Gothenburg Sweden Sweden
2010 Tim Heed D 5 132 Anaheim Skellefteå AIK Sweden Sweden
FA Bjorn Krupp D FA FA Minnesota Kolner Haie Germany Canada


So there are 27 teams represented through prospects in the tournament this year. The 3 teams who don't have prospects to watch are New Jersey, Los Angeles, and Winnipeg. That's not to say the tournament shouldn't be watched by those fanbases, as there are many potential draft-ready prospects as well, such as Oliver Kylington, the defenseman from the Swedish team, Farjestad BK, Erik Cernak, the Slovakian defenseman on the HC Kosice team, and many others.

Note that this table does not include the multiple draft picks that did not pan out over the years. It's interesting to note that as of today, the leading scorer for the tournament is Maple Leafs' prospect Andreas Johnson (2013 7th round, 202 overall), with 9 points in 2 games (2G, 7A).

Am I missing anybody from the table? Let me know!

Like what you read? Follow me on Twitter @DTJ_AHockeyBlog.

Tuesday, August 19, 2014

What Can We Expect From Radim Vrbata On The Canucks?

Radim Vrbata is a 33 year-old Czech forward who has been playing in the NHL since the 2001-2002 season. He has played the last 6 years of his career on the Phoenix (now Arizona) Coyotes at the right wing position (mostly) on the top line paired with centers like Martin Hanzal and Mike Ribeiro, from last season. The 6'1", 194-pound Czech-born, selected by Colorado in the 7th round (212 overall) of the 1999 NHL entry draft, signed with the Vancouver Canucks early in June to a two year contract with an AAV of $5 million. This post will look at Vrbata's playing ability and how well he will fit with the Canucks.

Last season, Vrbata scored 20 goals and 51 points in 80 games played. Vrbata's breakout season was in 2011-2012, where he scored 35 goals and 62 points in 77 games played. Over the past 4 seasons (including the lockout-shortened 2012-2013 season), Vrbata has scored 86 goals and 189 points in 270 games played. Vrbata has experience playing on the top 3 lines and has proven himself to be a potential 35-goal scorer in a season.

For more possession stats, we turn to hockeyanalysis.com (mainly because ExtraSkater is down) and look at Vrbata's Corsi For% over the past 4 seasons. From the 2011-2014 seasons, Vrbata displayed a 51.8% Corsi For stat. To see whether or not this stat was caused by inflation from a competent, or elite linemate, one can look at two sets of stats: Corsi Relative% and WOWY. Corsi Relative% is a measurement differential of the Corsi For% of a team when the player is on the ice vs. when the player is off the ice. A positive Corsi Relative% means the player is a positive possession asset to the team (the team has better possession stats when he is on the ice), while a negative Corsi Relative% means the player is a possession liability to the team (better possession stats when the player is off the ice). Vrbata's Corsi Relative% over the last 4 seasons, according to behindthenet.ca, was a +10.7%. I won't lie, that seems rather high, but without ExtraSkater, I'm going to have to believe it. One other way of looking at stats would be using WOWY (With or Without You) stats, which measures possession stats for two players while they are on and off the ice. From 2011-2014, Vrbata's linemate, Martin Hanzal, had a slight inflation of Corsi For% while on the ice with Vrbata. Hanzal had a 47.9% Corsi For without Vrbata, and 52.9% with him.

So how does this match up with Vrbata's potential line-mates, Henrik and Daniel Sedin? Well, looking at the Corsi For% of the two as a duo, through WOWY stats, the duo boasted a remarkable 60% Corsi For from the period of 2011-2014. I included the multiple years to try and establish a more credible stat baseline from a greater sample size. Looking at how Daniel Sedin might inflate Vrbata's possession stats even more, we can look back at the Sedin WOWY stats and look at other top line-mates, Alex Burrows and Ryan Kesler. From 2011-2014, when paired with Daniel Sedin, Burrows had a 59.7% Corsi For, and a 54.2% without Sedin. In the same time span, when paired with Daniel Sedin, Kesler had a 58.9% Corsi For and a 52.9% without. These are around 5.5% inflations to possession stats. This would mean that it is not out of the question to see Vrbata with a Corsi For% of roughly around 55% this upcoming season. I know that is a very loose prediction, as Vrbata may not gel well with the Sedins, but these are over the past 4 seasons, so they do carry a bit more weight than just outlier performances for any player, in either direction.

So how does Vrbata impact the Canucks offense? In order to accurately predict a number of goals scored by Vrbata, I took the average number of shots/season he had over the past 5 full NHL seasons (so this excludes the lockout-shortened 2011-2012 season), which is 249.4 shots. I then multiplied this by his career shooting percentage, which is 9.3%, and got a rough estimate of goals to expect from Vrbata, which is 23 goals. This is entirely based off Vrbata's own stats, and I have not included any sort of inflation from the Sedins' stats. What this does mean, though, is that if the Sedins have a bounce-back season, mainly Daniel, especially because he suffered an injury in the last game of the season, Vrbata's offensive output will increase significantly.

From 2011-2014, Radim Vrbata averaged 0.904 goals per 60 min and 1.855 points per 60 min of 5v5 (even strength) ice time , and 1.78 goals per 60 min and 4.116 points per 60 min of powerplay time. Compare this to Henrik Sedin, from the Canucks, who averaged 0.414 goals per 60 min and 2.193 points per 60 min of even strength ice time, and 1.077 goals per 60 min and 4.489 points per 60 min of Powerplay time (from 2011-2014). From the same time slot, Daniel Sedin averaged the exact same numbers as his identical twin brother, Henrik, as noted above. No, I'm not making that up.

So what does this mean? Essentially, it means that Vrbata will inject a dosage of goal-scoring ability to the lineup. Compliment that with the Sedins finding their form again as one of the top-passing duos in the league, and we could potentially see Vrbata score upwards of 28 goals and 60+ points this season.

So let's move away from numbers and look into the actual play of Radim Vrbata. I chose this video mainly because I was unable to find a compilation of his goals from the last season, but also to show his potential as a 30+ goal scorer. So here is a compilation of all 35 of his regular season goals from the 2011-2012 season:


Like I've done in previous articles, I will not go into detail about every single goal of his. I would like to note, though, at how good Vrbata's positioning is, as most of the goals above are a direct result of his positioning. It's also good to note his potential on the Powerplay as well.

I'm a very visual person, and I'd like to be able to see from where on the ice a player is scoring, so I decided to try out something new to me (I'm not sure how common it may be among other writers or whatnot) that I would call, Goal Mapping.What I did was take a picture of a hockey rink from this source, peruse through NHL.com's video highlights of games this past season and map out just where Radim Vrbata scored his 20 goals in the 2013-2014 season.


I know this is a very raw idea so far, but here is a closer look at the half of the rink that I used to diagram:


Just a quick key:
W - Wrist Shot
S - Slap Shot
O - One-timer
D - Deflection
R - Rebound
B - Backhand
E - Empty Net

What do you folks think of this idea? I know it still has to be fine-tuned.

Let's look at where Vrbata scored last season. The dominant theme that can be determined is that either Vrbata is positioned well in the center slot for a rebound or wrist shot, or he is quite good at creating space for himself and skating to a shooting position in the slot.

Vrbata has proven to be a 20-goal scorer throughout his career, and now has the chance to play on a line with some of the best playmaking forward duos in the NHL, the Sedin brothers. With his injection of offense and forward depth into the lineup, Radim Vrbata will have "Gold On The Ceiling" playing a lot more in Rogers Arena over the next two seasons.

Thanks for reading!

Like what you read? Follow me on Twitter @DTJ_AHockeyBlog or leave a comment! Thanks for reading.